AM Detector
Recovers market volatility from the amplitude-modulated whitened price spectrum.
Visual Example
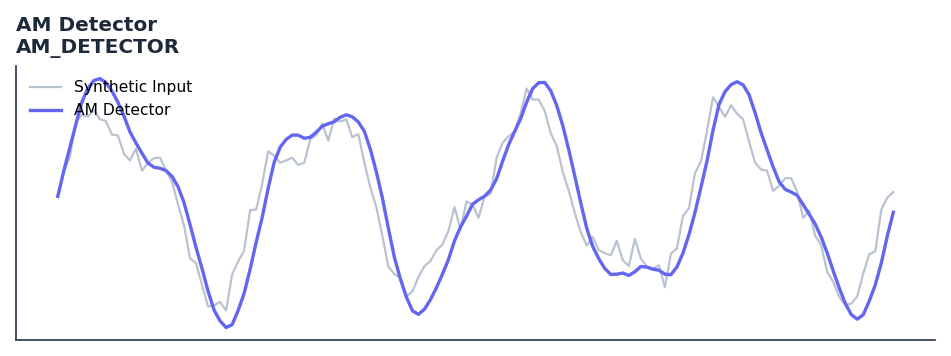
Synthetic ideal per library logic. Generated 2026-06-25 IST via docs/generate_all_previews.py (reproducible; maps to core Next<T> implementation).
Description
The AM Detector indicator is a technical analysis tool that recovers market volatility from the amplitude-modulated whitened price spectrum.
This indicator is primarily used for identifying key market conditions. It provides a robust signal that can be easily integrated into both simple strategies and more complex machine learning feature pipelines. Compared to its alternatives, it offers a distinct balance of responsiveness and stability.
Traders often combine this with other metrics to confirm signals and avoid false positives during sideways market regimes. It remains a standard tool for systematic trading models.
Use to extract the instantaneous amplitude and frequency of market cycles. The AM output measures cycle energy for position sizing; the FM output tracks cycle period for adaptive indicator tuning.
Ehlers adapts AM and FM demodulation techniques from radio engineering in Cycle Analytics for Traders to extract cycle amplitude and instantaneous frequency from market data. The amplitude envelope measures how energetic the current cycle is, while FM reveals whether the cycle period is expanding or contracting.
QuantWave implements this indicator via the universal Next<T> trait, guaranteeing bit-identical results between Rust streaming, Python streaming, and Polars batch (.ta() / map_batches) surfaces.
Formula / Specification
Implementation (quantwave-core/src/indicators/amfm.rs):
Gold-standard parity vectors: quantwave-core/tests/gold_standard/am_detector.json.
Parameters
| Parameter | Default | Description |
|---|---|---|
highest_len |
4 | Envelope lookback length |
avg_len |
8 | Smoothing length |
Usage Examples
Streaming (Rust)
use quantwave_core::indicators::AM_DETECTOR;
use quantwave_core::traits::Next;

let mut ind = AM_DETECTOR::new(4);
for price in &prices {
    let value = ind.next(price);
}
Streaming (Python)
Polars Batch (Python)
import polars as pl
import quantwave as qw

def apply_am_detector(series: pl.Series) -> pl.Series:
    ind = qw.AM_DETECTOR(4)
    return pl.Series([ind.next(float(v)) for v in series.to_list()])

df = (
    pl.read_csv('ohlcv.csv')
    .lazy()
    .with_columns(
        pl.col("close").map_batches(apply_am_detector, return_dtype=pl.Float64).alias("am_detector")
    )
    .collect()
)
All surfaces are bit-identical via the single Next<T> implementation and proptests.
Edge Cases & Limitations
- Recursive DSP filters require a warm-up period; first N bars may be unstable or raw-pass-through.
- Designed for cyclic/mean-reverting regimes; trending markets can produce lag or drift.
- Parameter
period(or equivalent) controls cutoff — too small adds noise, too large adds lag. - Prefer chaining with other Ehlers tools (Roofing Filter, SuperSmoother) on noisy inputs.
- Validated via proptests against gold-standard vectors where available.
- No look-ahead bias; suitable for live streaming and batch feature pipelines.
Boundary Behavior
| Condition | Behavior |
|---|---|
| Warm-up | Leading bars return NaN until warmup_bars is satisfied. |
| period > len | When period exceeds series length, output is all NaN. |
| NaN inputs | NaN in input propagates to output (NaN out). |
| Invalid params | Non-positive period or missing required params raise ValueError. |
| Empty data | Empty input returns an empty result series. |
Related Indicators & See Also
Sources & References
Primary Source: https://github.com/lavs9/quantwave/blob/main/references/Ehlers%20Papers/AMFM.pdf
Implementation: quantwave-core/src/indicators/amfm.rs (AM_DETECTOR / AM_DETECTOR_METADATA).
Parity: quantwave-core/tests/gold_standard/am_detector.json
Provenance: Standards bulk upgrade 2026-06-25 IST — see docs/DOCUMENTATION_STANDARDS.md.