Ehlers Loops
Converts price (and optionally volume) into RMS-normalized units via a high-pass + SuperSmoother cascade. Plotting the resulting series against its derivative (or price-RMS vs vol-RMS) produces characteristic "loops" in phase space that reveal cycle regime and turning points visually before they are obvious in the price chart.
Visual Example
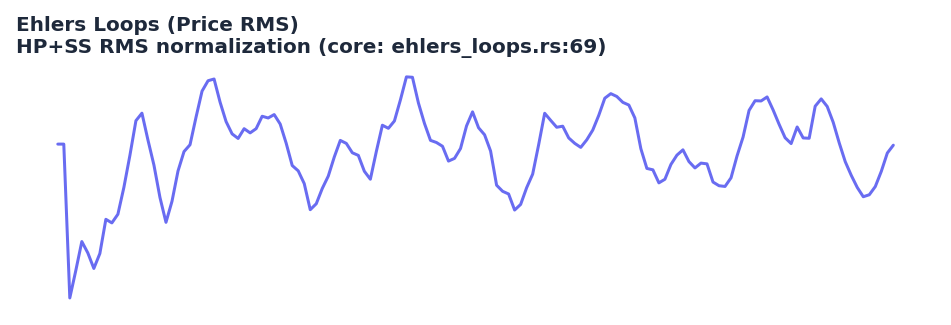
Synthetic ideal price series with strong cycle component. The RMS normalization (HP Butterworth + SuperSmoother + running mean-square) matches the NormalizedRoofing internal struct and RMS output in quantwave-core/src/indicators/ehlers_loops.rs (lines 69-140+). Generated 2026-05-31 IST via docs/gen_indicator_previews.py.
Description
Ehlers Loops are a visualization and analysis technique rather than a single scalar trading signal. By normalizing price and volume into units of standard deviation (RMS) after removing trend with a high-pass filter and smoothing with a SuperSmoother, the resulting time series have stable statistical properties. When you plot the normalized price against its rate-of-change (or against normalized volume), the trajectory traces elliptical loops while the market is in a clean cycle regime. When a trend dominates, the loops collapse into a straight line or narrow band.
The indicator is primarily used for discretionary regime identification, for building custom scatter-plot features in ML pipelines, and as a diagnostic when tuning other Ehlers DSP parameters. The core EhlersLoops struct returns the price-RMS series (volume-RMS is computed identically on a separate channel). All computation is causal and participates in the universal parity contract.
Formula / Specification
Exact implementation in QuantWave (quantwave-core/src/indicators/ehlers_loops.rs):
The NormalizedRoofing helper (used for both price and volume channels) implements:
- 2-pole Butterworth high-pass (period = hp_period) with exact coefficients:
hpc1, hpc2, hpc3derived fromexp(−1.414·π / hp)and cosine term. - 2-pole SuperSmoother low-pass (period = lp_period) with analogous
ssc*coefficients. - Recursive HP and SS state (order-2 histories).
- Running mean-square
MS = α·SS² + (1−α)·MS(α typically small). - Output
RMS = SS / √MS(guarded against zero).
The public EhlersLoops maintains separate normalizers for price and volume and exposes the price RMS (volume RMS available via the same math).
Parameters
| Parameter | Default | Description |
|---|---|---|
lp_period |
20 | Low-pass (SuperSmoother) period for the final smoothing stage. |
hp_period |
125 | High-pass (Butterworth) period used to remove trend before normalization. |
Usage Examples
Streaming (Rust)
use quantwave_core::indicators::EhlersLoops;
use quantwave_core::traits::Next;

let mut loops = EhlersLoops::new(20, 125);
for price in price_series {
    let rms = loops.next(price);  // price RMS; volume path separate if needed
    // Plot rms vs its derivative or feed to custom phase feature
}
Streaming (Python)
from quantwave import EhlersLoops

loops = EhlersLoops(20, 125)
for price in price_series:
    rms = loops.next(price)
Polars Batch (Python — primary research / feature surface)
import polars as pl
import quantwave as qw

def ehlers_loops_expr(col: str, lp=20, hp=125):
    el = qw.EhlersLoops(lp, hp)
    def _apply(s: pl.Series) -> pl.Series:
        return pl.Series([el.next(float(v)) for v in s.to_list()])
    return pl.col(col).map_batches(_apply, return_dtype=pl.Float64)

df = (
    pl.read_csv("ohlcv.csv")
    .lazy()
    .with_columns([ehlers_loops_expr("close").alias("price_rms")])
    .collect()
)
Edge Cases & Limitations
- The first several bars return 0 while the order-2 filter states fill.
- In extremely low-volatility regimes MS can approach zero, producing large RMS spikes (implementation guards exist).
- The visualization power is highest when you actually render the phase plot (price-RMS vs d(RMS)/dt or vs vol-RMS); the scalar series alone is only an intermediate.
- hp_period = 125 is a long-term trend remover; shorter values leak trend into the loops and distort the ellipse geometry.
- Primarily a diagnostic and feature-engineering tool; it does not emit discrete buy/sell signals by itself.
- Volume channel (when used) must be supplied separately to a second instance or via the full struct API.
- No look-ahead bias; fully causal.
Boundary Behavior
| Condition | Behavior |
|---|---|
| Warm-up | Leading bars return NaN until warmup_bars is satisfied. |
| period > len | When period exceeds series length, output is all NaN. |
| NaN inputs | NaN in input propagates to output (NaN out). |
| Invalid params | Non-positive period or missing required params raise ValueError. |
| Empty data | Empty input returns an empty result series. |
Related Indicators & See Also
- Cyber Cycle, Homodyne Discriminator — other tools for measuring dominant cycle and regime
- Market Structure — combine loop shape with confirmed BOS for high-conviction regime calls
- Indicator Gallery • Native Indicators
- Ehlers Loops are discussed in the June 2022 Traders' Tips and in Cycle Analytics for Traders.
Sources & References
Primary Source: quantwave-core/src/indicators/ehlers_loops.rs (EHLERS_LOOPS_METADATA + NormalizedRoofing internals + proptest parity). Formula source: https://github.com/lavs9/quantwave/blob/main/references/traderstipsreference/TRADERS’%20TIPS%20-%20JUNE%202022.html (Ehlers Loops, Traders' Tips June 2022).
Visual: Generated 2026-05-31 IST via docs/gen_indicator_previews.py.
Additional Context: John Ehlers, Cybernetic Analysis for Stocks and Futures (2004) — the original source of the phase-space loop concept for market regime identification.
Implementation Provenance: Single Next<f64> truth in the core file; Python and Polars surfaces are thin delegates.