Geometric Patterns (Flags + Head & Shoulders)
Date: 2026-05-31 IST
Sources: MQL5 Price Action Analysis Toolkit
- Flags (continuation): Part 69 — https://www.mql5.com/en/articles/22503 + Flag_Pattern_Detector.mq5
- Head & Shoulders (reversal): Part 66 — https://www.mql5.com/en/articles/22194 + HS_Indicator.mq5
Archived: references/MQL5/lynnchris/implemented/Part69/ and Part66/.
Built on the shared Market Structure foundation (Part 21). Core: quantwave-core/src/indicators/geometric_patterns.rs.
The GeometricPatternScanner (exposed as .ta.geometric_patterns() in Polars) detects two high-value classical price action patterns using the confirmed swings and bias from MarketStructure:
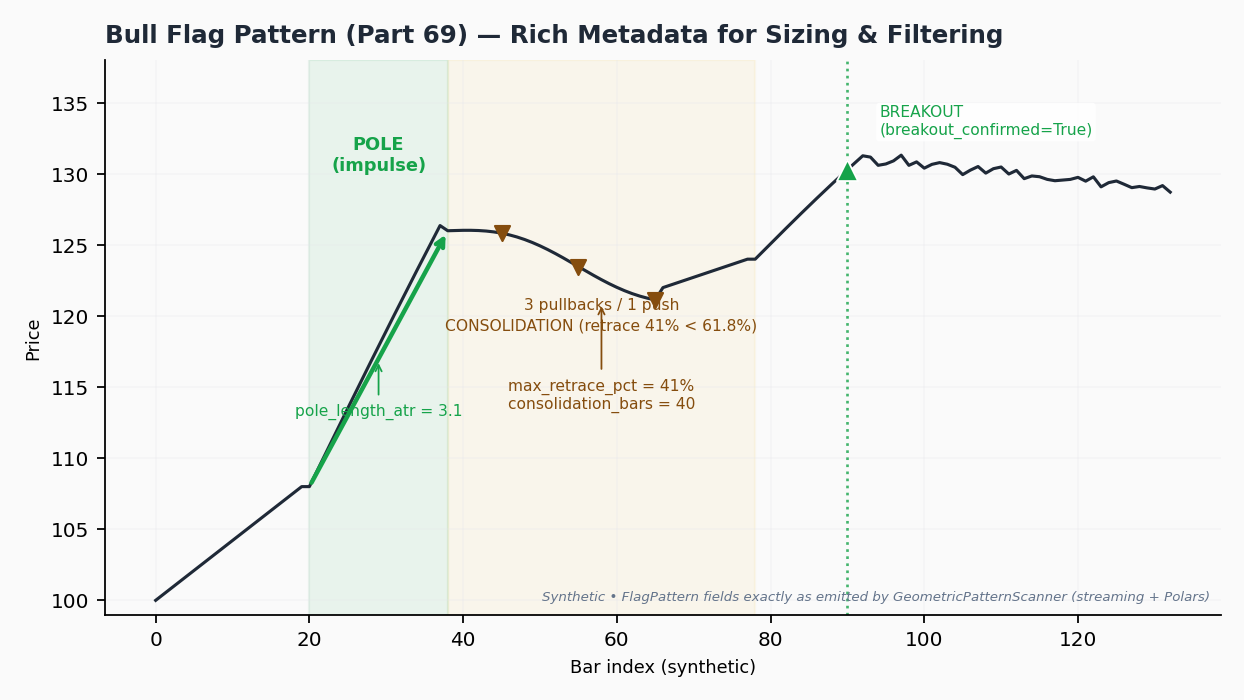
- Bull / Bear Flags — Powerful continuation patterns. A sharp impulse "pole" followed by a shallow, orderly consolidation (pullbacks dominate pushes, retrace typically ≤ 61.8%). Breakout in the pole direction is the trigger.
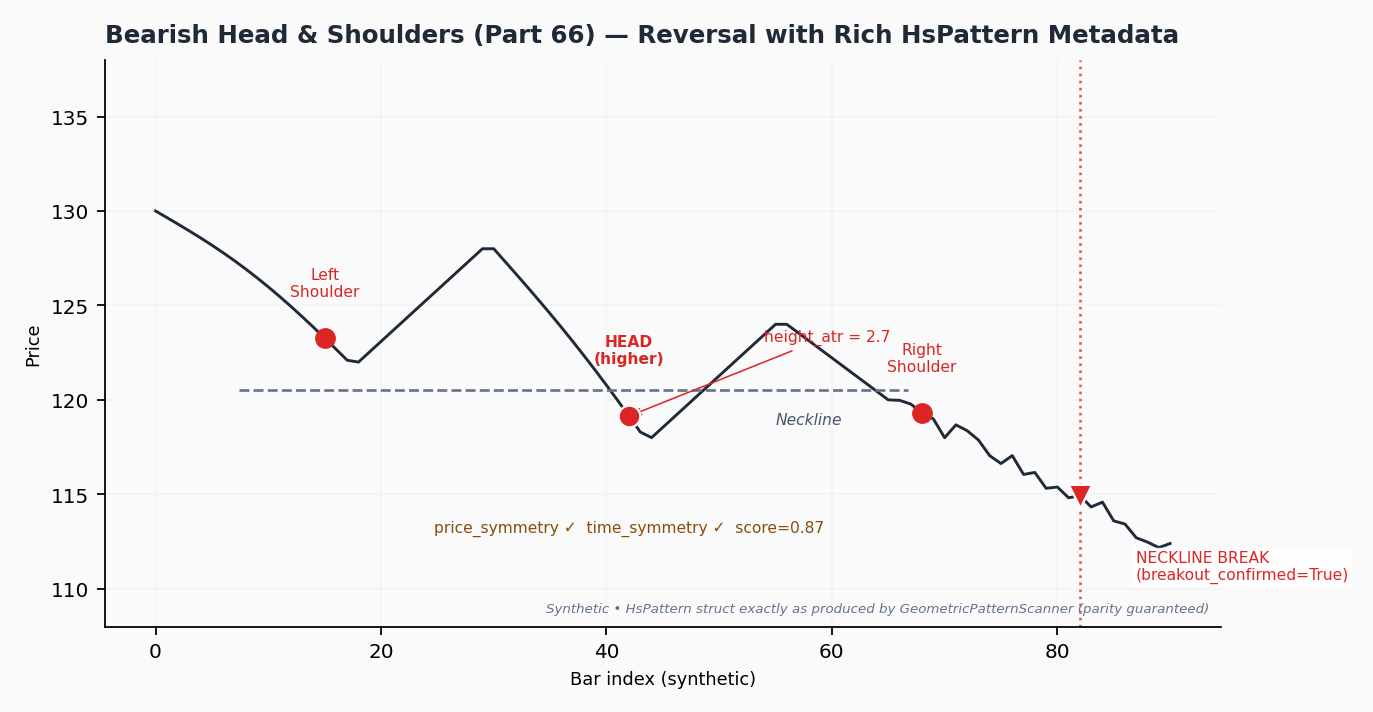
- Head & Shoulders (and Inverse) — Classic reversal patterns. A 5-swing formation with a dominant head, reasonable symmetry in price and time, and a decisive neckline breakout.
Both detectors emit rich, machine-readable structs (FlagPattern, HsPattern) instead of drawing objects. These structs contain exactly the quantitative fields you need for position sizing, quality filtering, and ML.
When to Use
Flags: - Trend-following continuation entries in the direction of established MarketStructure bias. - Situations where you want quantified risk (the pole length gives you a natural ATR-multiple stop/target distance).
Head & Shoulders:
- Counter-trend reversal plays at major turning points.
- Only high-score / high-symmetry instances (filter aggressively).
General: - As confluence with S/R levels (see sr_monitor). - As sparse, high-signal labels or features for ML models. - In event-driven backtesters that consume rich metadata for dynamic sizing.
Detection rules (MQL5-faithful):
- Flags: 3-bar impulse pole (≥
min_pole_atr× ATR), consolidation with retrace ≤ 61.8%, pullbacks ≥ pushes, breakout above/below pole extreme. - H&S: 5-swing window (H-L-H-L-H or inverse), shoulder symmetry ≤ 2%, height ≥ 1.5× ATR, composite score ≥ 60.
Flags emit on breakout_confirmed only; H&S emits on high-score pattern detection (neckline breakout optional in streaming).
Rich Metadata — The Real Power
FlagPattern (key fields)
pole_length_atr: The star field for strategies. Pole height expressed in ATR units at detection time. Directly drives position sizing.max_retrace_pct: How far price pulled back during consolidation (as % of pole). Classic flags stay under 0.618.pullbacks,pushes: Count of counter-moves vs. continuation moves inside the flag. Good flags usually have more pullbacks than pushes.consolidation_bars: Duration of the flag (time consolidation).breakout_confirmed,breakout_price,is_bull
HsPattern (key fields)
height_atr: Head height in ATR units (analogous to pole_length_atr).score: Composite quality score (0–1+). Higher is better; combine with symmetry.price_symmetry,time_symmetry: How balanced the left/right shoulders are.breakout_confirmed,breakout_price,is_bearish
Visual: Bull Flag
Sharp vertical impulse pole (e.g. bars 120–127), followed by 3 small pullbacks and 1 push inside a tight range (retracement 48%), then a decisive breakout candle above the pole high at bar 143. Annotations call out every FlagPattern field on the chart.
Visual: Bearish Head & Shoulders
Left shoulder, higher head, lower right shoulder, roughly flat or slightly declining neckline, followed by a strong close below the neckline. Labels for all five swing points, measured head height, symmetry percentages, and score.
Position Sizing Example Using Rich Metadata
# After detecting a confirmed bull flag on bullish structure
current_atr = atr_series[bar]
risk_per_unit = 0.5 * flag.pole_length_atr * current_atr   # 0.5× pole as risk distance
account = 100_000.0
risk_pct = 0.01  # 1% account risk per trade

contracts = (account * risk_pct) / risk_per_unit if risk_per_unit > 0 else 0
print(f"Position size: {contracts:.1f} units (risk = {risk_per_unit:.2f})")
This produces consistent R-multiples across different instruments and volatility regimes because the risk distance is normalized by the actual pattern size.
Practical Code Examples
Rust Streaming
use quantwave_core::indicators::geometric_patterns::GeometricPatternScanner;
use quantwave_core::traits::Next;

let mut scanner = GeometricPatternScanner::new(3);

for (h, l) in data {
    let (ms_state, flag, hs) = scanner.next((h, l));

    if let Some(f) = flag {
        if f.breakout_confirmed && ms_state.bias == Bias::Bullish {
            let size = compute_size_from_pole(f.pole_length_atr, current_atr);
            // enter long...
        }
    }
    if let Some(hs_pat) = hs {
        if hs_pat.breakout_confirmed && hs_pat.score > 0.75 {
            // high-quality reversal setup
        }
    }
}
Polars Batch (ideal for feature stores)
df = (
    pl.DataFrame({"high": highs, "low": lows})
    .lazy()
    .ta.market_structure("high", "low", 3)
    .ta.geometric_patterns("high", "low", 3)
    .collect()
)

# Rich nested access for ML labels / features
bull_flag_events = df.filter(
    pl.col("geometric_patterns").struct.field("flag")
      .struct.field("breakout_confirmed") &
    (pl.col("market_structure").struct.field("bias") == "Bullish")
)

features = bull_flag_events.select([
    pl.col("geometric_patterns").struct.field("flag").struct.field("pole_length_atr").alias("pole_atr"),
    pl.col("geometric_patterns").struct.field("flag").struct.field("max_retrace_pct"),
    # ... join other indicators at these exact bars
])
Canonical PA foundation notebook
End-to-end strategy wiring (MarketStructure filter + flag breakout + pole sizing sketch):
- pa_foundation_strategy.py
- pa_flag_breakout_strategy.py (full
.btbacktest tour)
Python Streaming
from quantwave import GeometricPatternScanner, MarketStructure

geo = GeometricPatternScanner(3)

for h, l in zip(highs, lows):
    # Note: in current Python surface the scanner also advances internal MS
    result = geo.next(h, l)  # returns GeometricNextResult
    flag = result.flag
    if flag and flag.breakout_confirmed:
        print(f"Flag pole_atr={flag.pole_length_atr:.2f}")
Python note: The streaming wrappers expose the core rich fields (including pole_length_atr, score, symmetry, breakout flags). For the absolute fullest metadata during research, use Polars or direct Rust.
ML & Strategy Integration Ideas
- Features:
flag_pole_atr_norm(normalized by rolling ATR or recent range)flag_retrace_quality(1 if max_retrace_pct < 0.55 else 0)hs_score,hs_symmetry_avgpattern_on_bull_structure(interaction feature)-
Binary labels for "flag breakout occurred" aligned to future returns
-
Filters: Only trade Flags when
pole_length_atr > 1.5and structure bias agrees. Only trade H&S whenscore > 0.8andtime_symmetry > 0.7. -
Confluence: Join geometric events with
SRInteractionevents on the same bar (flag breakout at major support = high edge). -
Backtester consumption: Pass the entire
FlagPattern/HsPattern(or wrappedPAEvent) into your position sizer. The metadata travels with the signal.
Full end-to-end demonstration (including regime + Hurst filter + realistic equity curve sketch) lives in the runnable notebooks.
Parameters
swing_strength(default: 3–5): Passed through to the underlyingMarketStructure. Controls swing granularity for both flags and H&S.
Metadata source of truth: GEOMETRIC_PATTERNS_METADATA constant (links directly to the two MQL5 parts).
Related Pages
- Market Structure — required foundation
- S/R Interactions — confluence
- Using Rich PA Events
- Strategy deep-dive notebook: pa_flag_breakout_strategy.md and
pa_foundation_strategy.py - MQL5 Part 69 (Flags): https://www.mql5.com/en/articles/22503
- MQL5 Part 66 (H&S): https://www.mql5.com/en/articles/22194
All detectors maintain full streaming ↔ Polars batch parity via proptests.