S/R Interactions (Support & Resistance Monitoring)
Date: 2026-05-31 IST
Sources: MQL5 Price Action Analysis Toolkit (Part 67) — Support/Resistance interactions by lynnchris. Article: https://www.mql5.com/en/articles/21961. Archived: references/MQL5/lynnchris/implemented/Part67/SupportResistanceMonitor.mq5.
Core implementation: quantwave-core/src/indicators/sr_monitor.rs (composes MarketStructure).
The SRInteractionMonitor (Rust) provides real-time classification of price behavior around horizontal support and resistance levels. Levels can be:
- Auto-generated from confirmed MarketStructure swing points (with provenance tracking).
- User-provided dynamically (perfect for strategy-defined levels, round numbers, or previous day high/low).
Every bar it reports zero or more SRInteraction events with precise classification:
- Approach — Price entered the outer zone (early warning).
- Touch — Price overlapped the level within tolerance.
- Breakout — Price crossed the level (side change).
- Reversal — After a Touch, price returned to the original side without breaking.
- Retest — After a confirmed Breakout, price returned to the level (classic "retest of broken level").
When to Use
- Confluence engines: "Only take this bull flag breakout if it occurs at a major support level that has already seen 3+ touches."
- Mean-reversion strategies around high-strength touches or reversals.
- Breakout trading with retest filter: Wait for Breakout + successful Retest before entry (dramatically improves win rate on many instruments).
- Feature engineering: Count touches on current support over last N bars, distance to nearest level, interaction type one-hot, strength at interaction.
- Event-driven backtesting: Every interaction is a first-class timestamped event carrying
distance_at_event,strength, andsource.
Note: As of this release the rich S/R surface is primarily available via the Rust streaming API (SRInteractionMonitor). Polars .ta() exposure and full Python bindings are on the near-term roadmap (the underlying engine is production-ready).
Rich Event Metadata
SRInteraction (primary output inside SRMonitorOutput.interactions):
bar,level_price,level_label(human readable, e.g. "R_auto_87" or "UserPivot_1.2345")is_support: boolinteraction: Approach | Touch | Breakout | Reversal | Reteststrength: Importance (for auto levels: the structure_count at swing creation; for user levels: can be incremented on repeated touches)bars_since_creationdistance_at_event: signed distance (positive = price above level)source:LevelSource::AutoSwing { origin_swing_bar, origin_strength }orUserProvided { user_id }
SRMonitorOutput also always carries the current MarketStructureState so you can apply bias/structure filters at the same moment.
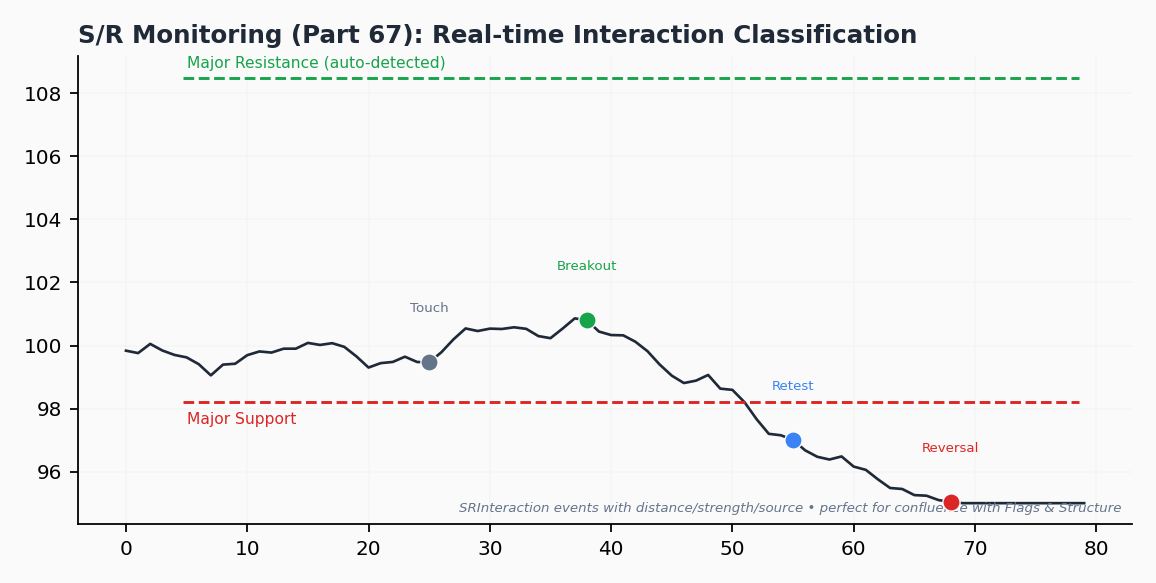
Visual: S/R Interaction Lifecycle
Price rises into a resistance level (Approach → Touch). It fails and reverses (Reversal). Later it breaks through decisively (Breakout). On the pullback it retests the level from above (Retest) and holds — a high-probability continuation setup. All five event types are annotated on the chart with strength and distance callouts.
Practical Usage (Rust Streaming — Current Primary Surface)
use quantwave_core::indicators::sr_monitor::SRInteractionMonitor;
use quantwave_core::traits::Next;

let mut monitor = SRInteractionMonitor::new(3, touch_tolerance=0.5, approach_zone=5.0);

let user_resist_id = monitor.add_user_level(112.40, "MajorResistance");

for (h, l, c) in highs.iter().zip(lows).zip(closes) {
    let out = monitor.next((*h, *l, *c));

    for inter in &out.interactions {
        if inter.interaction == SRInteractionType::Retest && inter.strength > 1.5 {
            // High-quality retest of a significant level
            if out.structure.bias == Bias::Bullish {
                // long bias + retest at support = strong setup
            }
        }
    }
}
Auto levels are generated internally from the MarketStructure swings. You can also register multiple user levels at any time.
Polars / Python
While direct .ta.sr_monitor() is not yet exposed in the Polars namespace, you can:
- Generate the MarketStructure + swing points via Polars.
- Feed the swing-derived levels into a small Rust or Python loop (or the backtester) that runs
SRInteractionMonitor. - Or join externally computed interaction events on
barindex.
See the main PA notebook for patterns of combining the three tools.
Strategy & ML Integration
Confluence example (pseudocode):
if (flag.breakout_confirmed and
    any(i.interaction == "Breakout" and i.level_price near flag.breakout_price
        for i in sr_interactions_on_same_bar)):
    # Flag breakout occurring at / through S/R = high conviction
ML features:
- touches_on_current_support_20
- nearest_level_distance_atr
- interaction_type_onehot (5 columns)
- auto_level_strength_at_event
- Interaction × geometric pattern cross features
The provenance (source) field lets you distinguish "organic" swing-based levels from your own strategy levels — extremely useful for attribution in both live trading and research.
Parameters
swing_strength: Passed to internal MarketStructure (controls auto level generation).touch_tolerance: Absolute price distance considered a "touch" (scale to instrument — e.g. 0.5 points, 5 pips, etc.).approach_zone: Outer buffer for pre-touch Approach signals (typically 3–10× touch tolerance).
Metadata source of truth: SR_INTERACTION_MONITOR_METADATA in sr_monitor.rs (keywords include "part-67").
Related
- Market Structure — supplies the auto levels and bias
- Geometric Patterns — pair with S/R for confluence
- Using Rich PA Events
- Comprehensive examples: pa_flag_breakout_strategy.md
- MQL5 Part 67: https://www.mql5.com/en/articles/21961
Full parity tests exist for the streaming implementation (including mixed auto + user level scenarios).