Hilbert Transform - Sine Wave (HT_SINE)
An indicator that plots a sine wave and a lead-sine wave (shifted by 45 degrees) to identify cyclical turns.
Visual Example
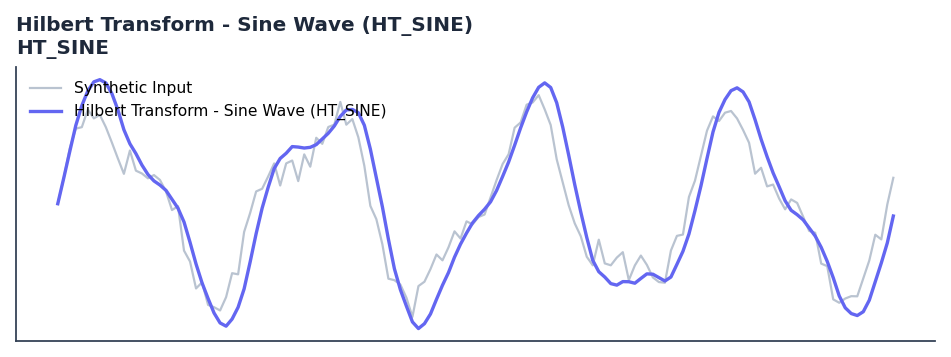
Synthetic ideal per library logic. Generated 2026-06-25 IST via docs/generate_all_previews.py (reproducible; maps to core Next<T> implementation).
Description
The Hilbert Transform - Sine Wave (HT_SINE) indicator is a technical analysis tool that an indicator that plots a sine wave and a lead-sine wave (shifted by 45 degrees) to identify cyclical turns.
This indicator is primarily used for identifying key market conditions. It provides a robust signal that can be easily integrated into both simple strategies and more complex machine learning feature pipelines. Compared to its alternatives, it offers a distinct balance of responsiveness and stability.
Traders often combine this with other metrics to confirm signals and avoid false positives during sideways market regimes. It remains a standard tool for systematic trading models.
Use to identify cycle turning points and trend regimes. When the two waves are separated and rhythmic, the market is in a cycle; when they are compressed or crossover erratically, the market is in a trend.
The Hilbert Sine Wave is one of John Ehlers' most famous contributions. It provides a clear visual indication of market cycles. Crossovers of the Sine and Lead-Sine waves provide high-probability entry points in ranging markets while identifying when a strong trend has taken over. — Rocket Science for Traders
QuantWave implements this indicator via the universal Next<T> trait, guaranteeing bit-identical results between Rust streaming, Python streaming, and Polars batch (.ta() / map_batches) surfaces.
Formula / Specification
Implementation (quantwave-core/src/indicators/cycle.rs):
Gold-standard parity vectors: quantwave-core/tests/gold_standard/ht_sine.json.
Parameters
| Parameter | Default | Description |
|---|---|---|
| (none) | — | No tunable parameters for this detector. |
Usage Examples
Streaming (Rust)
use quantwave_core::indicators::HT_SINE;
use quantwave_core::traits::Next;

let mut ind = HT_SINE::new(14);
for price in &prices {
    let value = ind.next(price);
}
Streaming (Python)
Polars Batch (Python)
import polars as pl
import quantwave as qw

def apply_hilbert_transform_sine_wave_ht_sine(series: pl.Series) -> pl.Series:
    ind = qw.HT_SINE(14)
    return pl.Series([ind.next(float(v)) for v in series.to_list()])

df = (
    pl.read_csv('ohlcv.csv')
    .lazy()
    .with_columns(
        pl.col("close").map_batches(apply_hilbert_transform_sine_wave_ht_sine, return_dtype=pl.Float64).alias("hilbert_transform_sine_wave_ht_sine")
    )
    .collect()
)
All surfaces are bit-identical via the single Next<T> implementation and proptests.
Edge Cases & Limitations
- Recursive DSP filters require a warm-up period; first N bars may be unstable or raw-pass-through.
- Designed for cyclic/mean-reverting regimes; trending markets can produce lag or drift.
- Parameter
period(or equivalent) controls cutoff — too small adds noise, too large adds lag. - Prefer chaining with other Ehlers tools (Roofing Filter, SuperSmoother) on noisy inputs.
- Validated via proptests against gold-standard vectors where available.
- No look-ahead bias; suitable for live streaming and batch feature pipelines.
Boundary Behavior
| Condition | Behavior |
|---|---|
| Warm-up | Leading bars return NaN until warmup_bars is satisfied. |
| period > len | When period exceeds series length, output is all NaN. |
| NaN inputs | NaN in input propagates to output (NaN out). |
| Invalid params | Non-positive period or missing required params raise ValueError. |
| Empty data | Empty input returns an empty result series. |
Related Indicators & See Also
Sources & References
Primary Source: https://www.tradingview.com/support/solutions/43000502013-hilbert-transform-sine-wave-ht-sine/
Implementation: quantwave-core/src/indicators/cycle.rs (HT_SINE / HT_SINE_METADATA).
Parity: quantwave-core/tests/gold_standard/ht_sine.json
Provenance: Standards bulk upgrade 2026-06-25 IST — see docs/DOCUMENTATION_STANDARDS.md.