Ichimoku Cloud
Ichimoku Kinko Hyo is a comprehensive indicator that defines support and resistance, identifies trend direction, gauges momentum and provides trading signals.
Visual Example
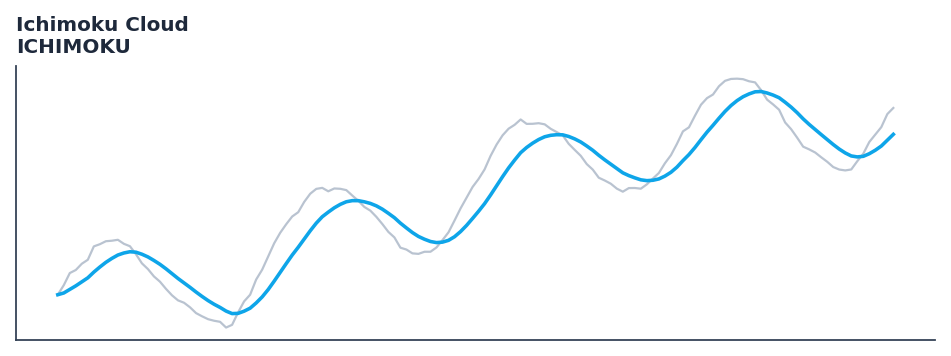
Synthetic ideal per library logic. Generated 2026-06-25 IST via docs/generate_all_previews.py (reproducible; maps to core Next<T> implementation).
Description
The Ichimoku Cloud indicator is a technical analysis tool that ichimoku kinko hyo is a comprehensive indicator that defines support and resistance, identifies trend direction, gauges momentum and provides trading signals.
This indicator is primarily used for identifying key market conditions. It provides a robust signal that can be easily integrated into both simple strategies and more complex machine learning feature pipelines. Compared to its alternatives, it offers a distinct balance of responsiveness and stability.
Traders often combine this with other metrics to confirm signals and avoid false positives during sideways market regimes. It remains a standard tool for systematic trading models.
Use as a complete trend system providing support, resistance, momentum, and cloud-based bias in a single indicator. The Kumo cloud thickness indicates trend strength.
Ichimoku Kinko Hyo was developed by Goichi Hosoda in the 1960s. The system comprises five components: Tenkan-sen (9-period midpoint), Kijun-sen (26-period midpoint), Senkou Span A and B (cloud), and Chikou Span (lagged close). Price above the cloud is bullish; the cloud thickness quantifies the strength of support or resistance. — Ichimoku Charts, Nicole Elliott
QuantWave implements this indicator via the universal Next<T> trait, guaranteeing bit-identical results between Rust streaming, Python streaming, and Polars batch (.ta() / map_batches) surfaces.
Formula / Specification
Implementation (quantwave-core/src/indicators/ichimoku.rs):
Gold-standard parity vectors: quantwave-core/tests/gold_standard/ichimoku.json.
Parameters
| Parameter | Default | Description |
|---|---|---|
tenkan_period |
9 | Tenkan-sen period |
kijun_period |
26 | Kijun-sen period |
senkou_span_b_period |
52 | Senkou Span B period |
Usage Examples
Streaming (Rust)
use quantwave_core::indicators::ICHIMOKU;
use quantwave_core::traits::Next;

let mut ind = ICHIMOKU::new(9);
for price in &prices {
    let value = ind.next(price);
}
Streaming (Python)
Polars Batch (Python)
import polars as pl
import quantwave as qw

def apply_ichimoku_cloud(series: pl.Series) -> pl.Series:
    ind = qw.ICHIMOKU(9)
    return pl.Series([ind.next(float(v)) for v in series.to_list()])

df = (
    pl.read_csv('ohlcv.csv')
    .lazy()
    .with_columns(
        pl.col("close").map_batches(apply_ichimoku_cloud, return_dtype=pl.Float64).alias("ichimoku_cloud")
    )
    .collect()
)
All surfaces are bit-identical via the single Next<T> implementation and proptests.
Edge Cases & Limitations
- Warm-up: first
9bars may return NaN or partial state per implementation. - Parameter sensitivity: smaller periods increase noise; larger periods increase lag.
- Sudden gaps or bad ticks can distort rolling windows — consider pre-filtering.
- Single-series indicators ignore volume unless otherwise documented.
- Validated via proptests against gold-standard vectors where available.
- No look-ahead bias; streaming and Polars batch paths are bit-identical.
Boundary Behavior
| Condition | Behavior |
|---|---|
| Warm-up | Leading bars return NaN until warmup_bars is satisfied. |
| period > len | When period exceeds series length, output is all NaN. |
| NaN inputs | NaN in input propagates to output (NaN out). |
| Invalid params | Non-positive period or missing required params raise ValueError. |
| Empty data | Empty input returns an empty result series. |
Related Indicators & See Also
Sources & References
Primary Source: https://www.investopedia.com/terms/i/ichimoku-cloud.asp
Implementation: quantwave-core/src/indicators/ichimoku.rs (ICHIMOKU / ICHIMOKU_METADATA).
Parity: quantwave-core/tests/gold_standard/ichimoku.json
Provenance: Standards bulk upgrade 2026-06-25 IST — see docs/DOCUMENTATION_STANDARDS.md.