Rate of Change (ROC)
A momentum-based technical indicator that measures the percentage change in price between the current price and the price n periods ago.
Visual Example
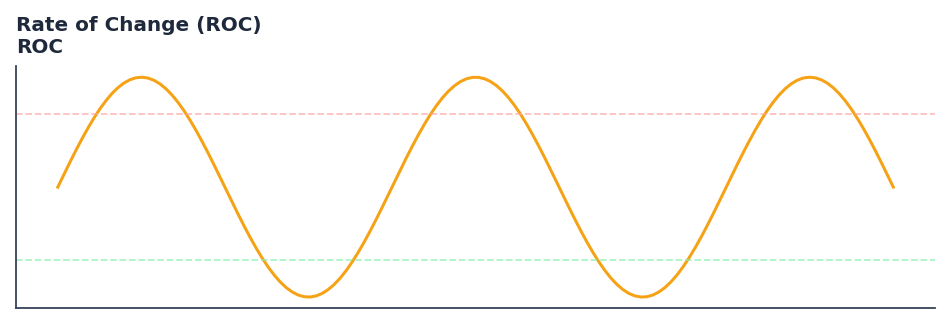
Synthetic ideal per library logic. Generated 2026-06-25 IST via docs/generate_all_previews.py (reproducible; maps to core Next<T> implementation).
Description
The Rate of Change (ROC) indicator is a technical analysis tool that a momentum-based technical indicator that measures the percentage change in price between the current price and the price n periods ago.
This indicator is primarily used for identifying key market conditions. It provides a robust signal that can be easily integrated into both simple strategies and more complex machine learning feature pipelines. Compared to its alternatives, it offers a distinct balance of responsiveness and stability.
Traders often combine this with other metrics to confirm signals and avoid false positives during sideways market regimes. It remains a standard tool for systematic trading models.
Use to measure the speed at which price is changing. It is often used to identify overbought/oversold conditions and trend reversals.
The Rate of Change (ROC) indicator is a pure momentum oscillator that measures the percentage change in price from one period to the next. It is highly effective at identifying the velocity of a move and anticipating when that velocity is slowing down. — StockCharts ChartSchool
QuantWave implements this indicator via the universal Next<T> trait, guaranteeing bit-identical results between Rust streaming, Python streaming, and Polars batch (.ta() / map_batches) surfaces.
Formula / Specification
Implementation (quantwave-core/src/indicators/momentum.rs):
Gold-standard parity vectors: quantwave-core/tests/gold_standard/roc.json.
Parameters
| Parameter | Default | Description |
|---|---|---|
timeperiod |
10 | Lookback period |
Usage Examples
Streaming (Rust)
use quantwave_core::indicators::ROC;
use quantwave_core::traits::Next;

let mut ind = ROC::new(10);
for price in &prices {
    let value = ind.next(price);
}
Streaming (Python)
Polars Batch (Python)
import polars as pl

df = (
    pl.read_csv('ohlcv.csv')
    .lazy()
    .with_columns(
        pl.col("close").ta.roc(10).alias("rate_of_change_roc")
    )
    .collect()
)
All surfaces are bit-identical via the single Next<T> implementation and proptests.
Edge Cases & Limitations
- Warm-up: first
10bars may return NaN or partial state per implementation. - Parameter sensitivity: smaller periods increase noise; larger periods increase lag.
- Sudden gaps or bad ticks can distort rolling windows — consider pre-filtering.
- Single-series indicators ignore volume unless otherwise documented.
- Validated via proptests against gold-standard vectors where available.
- No look-ahead bias; streaming and Polars batch paths are bit-identical.
Boundary Behavior
| Condition | Behavior |
|---|---|
| Warm-up | Leading bars return NaN until warmup_bars is satisfied. |
| period > len | When period exceeds series length, output is all NaN. |
| NaN inputs | NaN in input propagates to output (NaN out). |
| Invalid params | Non-positive period or missing required params raise ValueError. |
| Empty data | Empty input returns an empty result series. |
Related Indicators & See Also
Sources & References
Primary Source: https://www.investopedia.com/terms/r/rateofchange.asp
Implementation: quantwave-core/src/indicators/momentum.rs (ROC / ROC_METADATA).
Parity: quantwave-core/tests/gold_standard/roc.json
Provenance: Standards bulk upgrade 2026-06-25 IST — see docs/DOCUMENTATION_STANDARDS.md.