Volume Profile
Calculates the price level with the highest traded volume (Point of Control) over a sliding window.
Visual Example
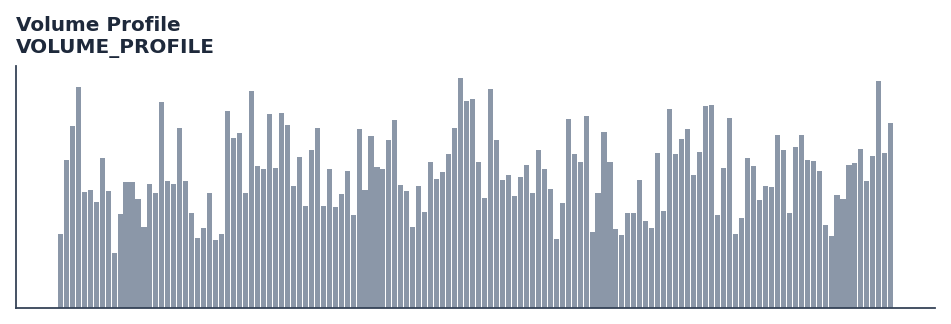
Synthetic ideal per library logic. Generated 2026-07-01 IST via docs/generate_all_previews.py (reproducible; maps to core Next<T> implementation).
Description
Calculates the price level with the highest traded volume (Point of Control) over a sliding window.
Use to identify significant support and resistance levels. The POC represents the price where most market activity occurred, often acting as a magnet for price or a strong barrier. Essential for volume spread analysis and auction market theory.
Volume-flow indicator for confirming price moves and detecting accumulation/distribution.
Volume Profile is an advanced charting study that displays trading activity over a specified time period at specified price levels. The Point of Control (POC) is the single most important level in the profile, representing the price at which the most volume was traded. It serves as a key benchmark for identifying value areas and potential trend reversals.
Typical applications:
- See Parameters — default period/length
200 - Validated via proptests and gold-standard vectors where available
- Use Polars
.taplugins for batch;streaming_class()for live
QuantWave implements this via the universal Next<T> trait — bit-identical across Rust streaming, Python streaming, and Polars .ta() batch plugins.
Formula / Specification
Implementation (quantwave-core/src/indicators/volume_profile.rs):
[ BinIdx = \lfloor \frac{Price - Price_{min}}{BinSize} \rfloor ] [ POC = Price_{min} + (Idx_{max_vol} + 0.5) \times BinSize ]
Gold-standard parity vectors: quantwave-core/tests/gold_standard/volume_profile.json.
Parameters
| Parameter | Default | Description |
|---|---|---|
period |
200 | Sliding window size |
bins |
50 | Number of price bins in the histogram |
Usage Examples
Streaming (Rust)
use quantwave_core::indicators::VOLUME_PROFILE;
use quantwave_core::traits::Next;

let mut ind = VOLUME_PROFILE::new(200);
for price in &prices {
    let value = ind.next(price);
}
Streaming (Python)
from quantwave import VOLUME_PROFILE

ind = VOLUME_PROFILE(200)
for price in prices:
    value = ind.next(price)
Polars Batch (Python)
import polars as pl
import quantwave as qw

def apply_volume_profile(series: pl.Series) -> pl.Series:
    ind = qw.VOLUME_PROFILE(200)
    return pl.Series([ind.next(float(v)) for v in series.to_list()])

df = (
    pl.read_csv('ohlcv.csv')
    .lazy()
    .with_columns(
        pl.col("close").map_batches(apply_volume_profile, return_dtype=pl.Float64).alias("volume_profile")
    )
    .collect()
)
All surfaces are bit-identical via the single Next<T> implementation and proptests.
Edge Cases & Limitations
- Warm-up: first
200bars may return NaN or partial state per implementation. - Parameter sensitivity: smaller periods increase noise; larger periods increase lag.
- Sudden gaps or bad ticks can distort rolling windows — consider pre-filtering.
- Single-series indicators ignore volume unless otherwise documented.
- Validated via proptests against gold-standard vectors where available.
- No look-ahead bias; streaming and Polars batch paths are bit-identical.
Boundary Behavior
| Condition | Behavior |
|---|---|
| Warm-up | Leading bars return NaN until warmup_bars is satisfied. |
| period > len | When period exceeds series length, output is all NaN. |
| NaN inputs | NaN in input propagates to output (NaN out). |
| Invalid params | Non-positive period or missing required params raise ValueError. |
| Empty data | Empty input returns an empty result series. |
Related Indicators & See Also
Sources & References
Primary Source: https://www.tradingview.com/support/solutions/43000502040-volume-profile-visible-range-vpvr/
Implementation: quantwave-core/src/indicators/volume_profile.rs (VOLUME_PROFILE / VOLUME_PROFILE_METADATA).
Parity: quantwave-core/tests/gold_standard/volume_profile.json
Provenance: Standards bulk upgrade 2026-07-01 IST — see docs/DOCUMENTATION_STANDARDS.md.