Fisher Transform
Converts any bounded input (typically -1 < x < 1) into a near-Gaussian distribution. The transform accentuates the largest deviations, producing extremely sharp peaks and troughs at market turning points that are statistically more significant than raw oscillator extremes.
Visual Example
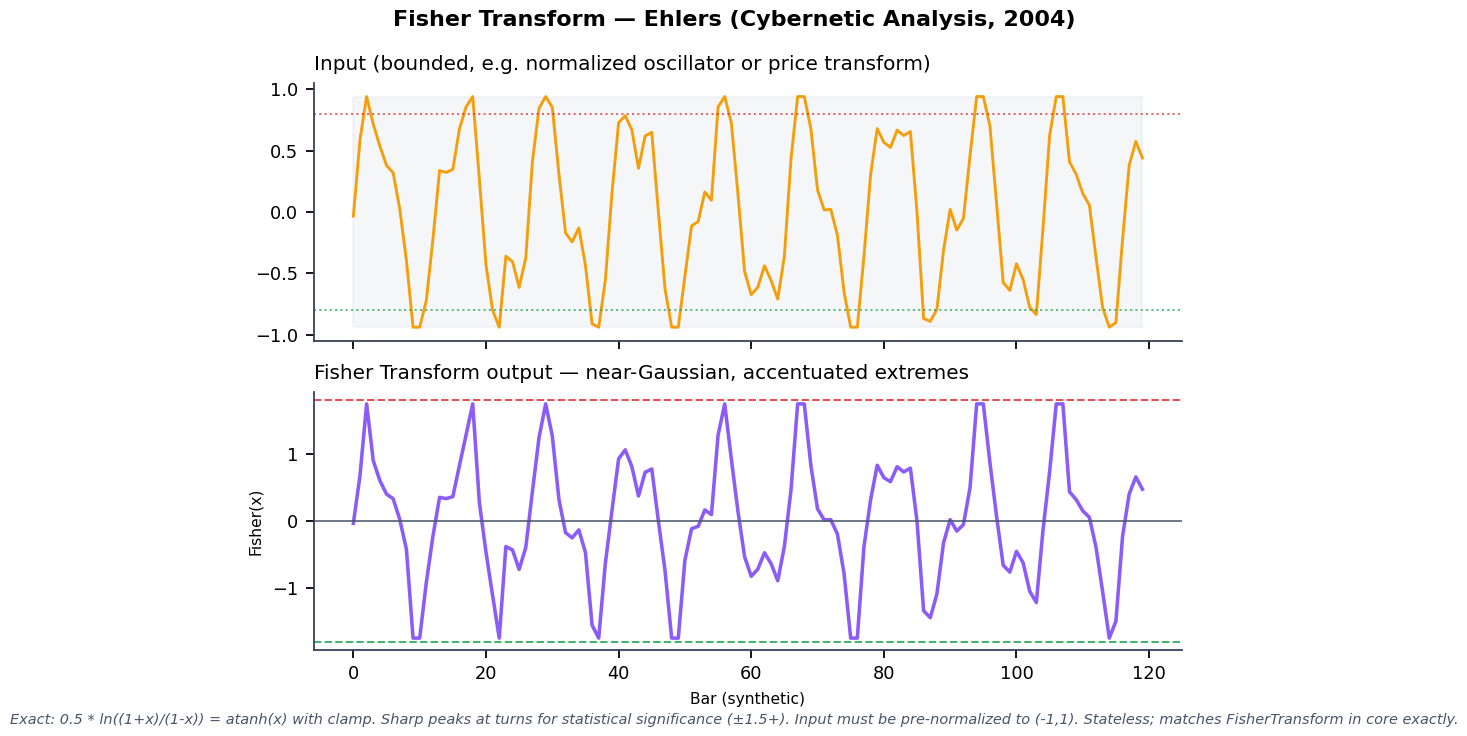
Synthetic bounded input (e.g. pre-normalized RSI, Cyber Cycle, or price transform). Output = 0.5 * ln((1+x)/(1-x)) = atanh(x) with safety clamp. Matches the stateless FisherTransform implementation in quantwave-core/src/indicators/fisher.rs exactly. Generated 2026-05-31 IST via docs/gen_indicator_previews.py.
Description
The Fisher Transform is a probability-density-function (PDF) corrector. Most financial indicators and price-derived series have a PDF that is far from Gaussian (often U-shaped or bounded). By applying the inverse hyperbolic tangent (atanh), any series that has been pre-normalized to the open interval (-1, +1) is mapped to a distribution whose tails are stretched, so that values that were merely "high" become statistically extreme (e.g. > ±1.5 or ±2.0).
The practical result is that crossovers of fixed thresholds on the Fisher-transformed series occur closer to actual turning points and with higher reliability than the same thresholds on the raw input. It is almost always applied as a post-processing step on an already bounded oscillator or on a price series that has been normalized (e.g. via stochastic %K or deviation scaling).
Formula / Specification
Exact (stateless) transform:
x_clamped = clamp(input, -0.999, 0.999)
Fish(x) = 0.5 * ln( (1 + x_clamped) / (1 - x_clamped) )   // exactly atanh(x)
The implementation is deliberately stateless — every call depends only on the current input value. All "memory" and normalization must be supplied by the caller (or by a preceding indicator such as a stochastic or Roofing + Cyber Cycle).
Parameters
| Parameter | Default | Description |
|---|---|---|
| (none) | — | Pure mathematical transform. The only constraint is that the input must lie in (-1, +1); values outside this range are clamped for numerical safety. |
Usage Examples
Streaming (Rust)
use quantwave_core::indicators::FisherTransform;
use quantwave_core::traits::Next;

let mut fish = FisherTransform::new();
for normalized_value in normalized_inputs {   // e.g. from RSI scaled to (-0.95,0.95) or CyberCycle trigger
    let f = fish.next(normalized_value);
    if f > 1.5 { /* statistically extreme bullish */ }
    if f < -1.5 { /* statistically extreme bearish */ }
}
Streaming (Python)
Polars Batch (Python — primary research / feature surface)
import polars as pl
import quantwave as qw

df = (
    pl.read_csv("ohlcv.csv")
    .lazy()
    .with_columns([
        pl.col("close").ta.fisher().alias("fisher"),   # input must already be normalized to (-1,1)
    ])
    .collect()
)
All surfaces are bit-identical (enforced by the universal Next<T> trait and proptests; here the transform is trivially stateless).
Edge Cases & Limitations
- Input outside (-1, +1) is clamped to ±0.999. Feeding raw unbounded prices or oscillators will produce garbage (or constant large values).
- Because it is memoryless, any lag or normalization error in the input series is faithfully passed through (and often magnified).
- Extremely effective on clean, pre-normalized cycle oscillators (Cyber Cycle, Roofing output, stochastic %K, etc.).
- On raw price or un-normalized series the output will be meaningless or saturated.
- The ±1.5 / ±1.8 / ±2.0 thresholds are conventional; backtest the exact level on your instrument and timeframe.
- No look-ahead bias (pure function of current bar).
Boundary Behavior
| Condition | Behavior |
|---|---|
| Warm-up | Leading bars return NaN until warmup_bars is satisfied. |
| period > len | When period exceeds series length, output is all NaN. |
| NaN inputs | NaN in input propagates to output (NaN out). |
| Invalid params | Non-positive period or missing required params raise ValueError. |
| Empty data | Empty input returns an empty result series. |
Related Indicators & See Also
- Inverse Fisher Transform — the approximate inverse (useful for visualization or certain ML targets)
- Cyber Cycle, Roofing Filter — ideal inputs after normalization
- Fisher High Pass — variant that includes internal high-pass + normalization
- Stochastic Oscillator and other bounded oscillators — classic candidates for Fisher post-processing
- Indicator Gallery • Native Indicators • Ehlers DSP Suite
docs/examples/notebooks/multi_indicator_analysis.py(normalization + transform examples)
Sources & References
Primary Source: John Ehlers, "Using The Fisher Transform" (article) and Cybernetic Analysis for Stocks and Futures (2004). PDF reference: references/Ehlers Papers/UsingTheFisherTransform.pdf.
Implementation Provenance: quantwave-core/src/indicators/fisher.rs. The single-line atanh implementation (with safety clamp) is the complete and exact source of mathematical truth. Stateless Next<f64> + parity proptests in the same file.
Visual: Generated 2026-05-31 IST via docs/gen_indicator_previews.py using a bounded synthetic oscillator chosen to demonstrate the tail-stretching effect.
Additional Context: One of the most widely ported Ehlers tools across platforms; the transform itself is a standard mathematical function (atanh) — Ehlers' contribution was popularizing its application to trading indicators after proper pre-normalization.