TTM Squeeze
TTM Squeeze measures the relationship between Bollinger Bands and Keltner Channels to identify volatility consolidations.
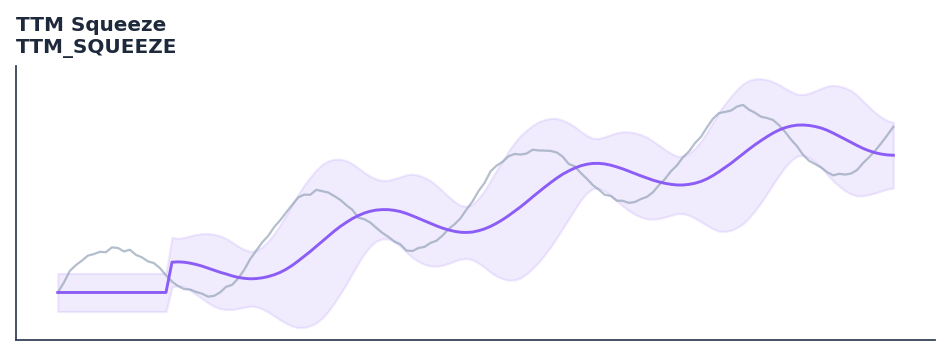
Visual Example
Synthetic ideal per library logic. Generated 2026-06-25 IST via docs/generate_all_previews.py (reproducible; maps to core Next<T> implementation).
Description
The TTM Squeeze indicator is a technical analysis tool that ttm squeeze measures the relationship between bollinger bands and keltner channels to identify volatility consolidations.
This indicator is primarily used for identifying key market conditions. It provides a robust signal that can be easily integrated into both simple strategies and more complex machine learning feature pipelines. Compared to its alternatives, it offers a distinct balance of responsiveness and stability.
Traders often combine this with other metrics to confirm signals and avoid false positives during sideways market regimes. It remains a standard tool for systematic trading models.
Use to identify periods of compressed volatility (Bollinger Bands inside Keltner Channels) followed by high-energy breakouts. The momentum histogram direction at squeeze release indicates trade direction.
The TTM Squeeze, developed by John Carter, identifies market consolidation by detecting when Bollinger Bands contract inside Keltner Channels — a squeeze condition indicating coiling energy. When the bands expand back outside the Keltner Channels, the squeeze releases and a momentum histogram shows the expected breakout direction. — Mastering the Trade, John Carter
QuantWave implements this indicator via the universal Next<T> trait, guaranteeing bit-identical results between Rust streaming, Python streaming, and Polars batch (.ta() / map_batches) surfaces.
Formula / Specification
Implementation (quantwave-core/src/indicators/ttm_squeeze.rs):
Gold-standard parity vectors: quantwave-core/tests/gold_standard/ttm_squeeze.json.
Parameters
| Parameter | Default | Description |
|---|---|---|
bb_period |
20 | Bollinger Bands Period |
bb_mult |
2.0 | Bollinger Bands Multiplier |
kc_period |
20 | Keltner Channel Period |
kc_mult |
1.5 | Keltner Channel Multiplier |
Usage Examples
Streaming (Rust)
use quantwave_core::indicators::TTM_SQUEEZE;
use quantwave_core::traits::Next;

let mut ind = TTM_SQUEEZE::new(20);
for price in &prices {
    let value = ind.next(price);
}
Streaming (Python)
from quantwave import TTM_SQUEEZE

ind = TTM_SQUEEZE(20)
for price in prices:
    value = ind.next(price)
Polars Batch (Python)
import polars as pl
import quantwave as qw

def apply_ttm_squeeze(series: pl.Series) -> pl.Series:
    ind = qw.TTM_SQUEEZE(20)
    return pl.Series([ind.next(float(v)) for v in series.to_list()])

df = (
    pl.read_csv('ohlcv.csv')
    .lazy()
    .with_columns(
        pl.col("close").map_batches(apply_ttm_squeeze, return_dtype=pl.Float64).alias("ttm_squeeze")
    )
    .collect()
)
All surfaces are bit-identical via the single Next<T> implementation and proptests.
Edge Cases & Limitations
- Warm-up: first
20bars may return NaN or partial state per implementation. - Parameter sensitivity: smaller periods increase noise; larger periods increase lag.
- Sudden gaps or bad ticks can distort rolling windows — consider pre-filtering.
- Single-series indicators ignore volume unless otherwise documented.
- Validated via proptests against gold-standard vectors where available.
- No look-ahead bias; streaming and Polars batch paths are bit-identical.
Boundary Behavior
| Condition | Behavior |
|---|---|
| Warm-up | Leading bars return NaN until warmup_bars is satisfied. |
| period > len | When period exceeds series length, output is all NaN. |
| NaN inputs | NaN in input propagates to output (NaN out). |
| Invalid params | Non-positive period or missing required params raise ValueError. |
| Empty data | Empty input returns an empty result series. |
Related Indicators & See Also
Sources & References
Primary Source: https://www.investopedia.com/articles/active-trading/110714/intro-ttm-squeeze-indicator.asp
Implementation: quantwave-core/src/indicators/ttm_squeeze.rs (TTM_SQUEEZE / TTM_SQUEEZE_METADATA).
Parity: quantwave-core/tests/gold_standard/ttm_squeeze.json
Provenance: Standards bulk upgrade 2026-06-25 IST — see docs/DOCUMENTATION_STANDARDS.md.